


Bitcoin struggles to reclaim $85K as larger investors accumulate, but altcoins face technical pressure. Here’s how BTC and top cryptos are shaping up.
📉 Bitcoin (BTC)
Bitcoin bulls attempted to break past $85,000, but sellers held firm. Still, accumulation by whales continues. According to Santiment, wallets holding 10+ BTC added roughly 5,000 BTC since March 3.
Arthur Hayes predicts a possible retest of $78,000, with potential volatility if BTC drops into the $70K–$75K range. BTC ETPs saw $756M in outflows, contributing to a four-week total of $4.75B across crypto ETPs.
Support to watch: $78,258
Resistance: $88,605 (20-day EMA)
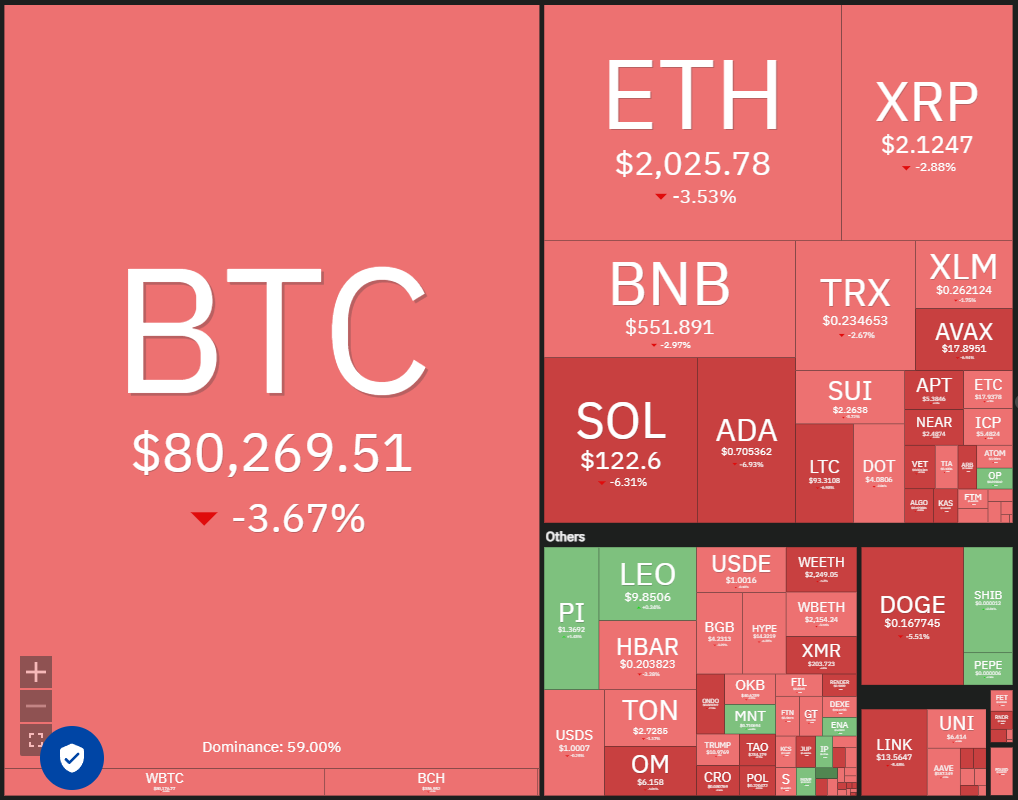
Daily cryptocurrency market performance. Source: Coin360
Ether price analysis
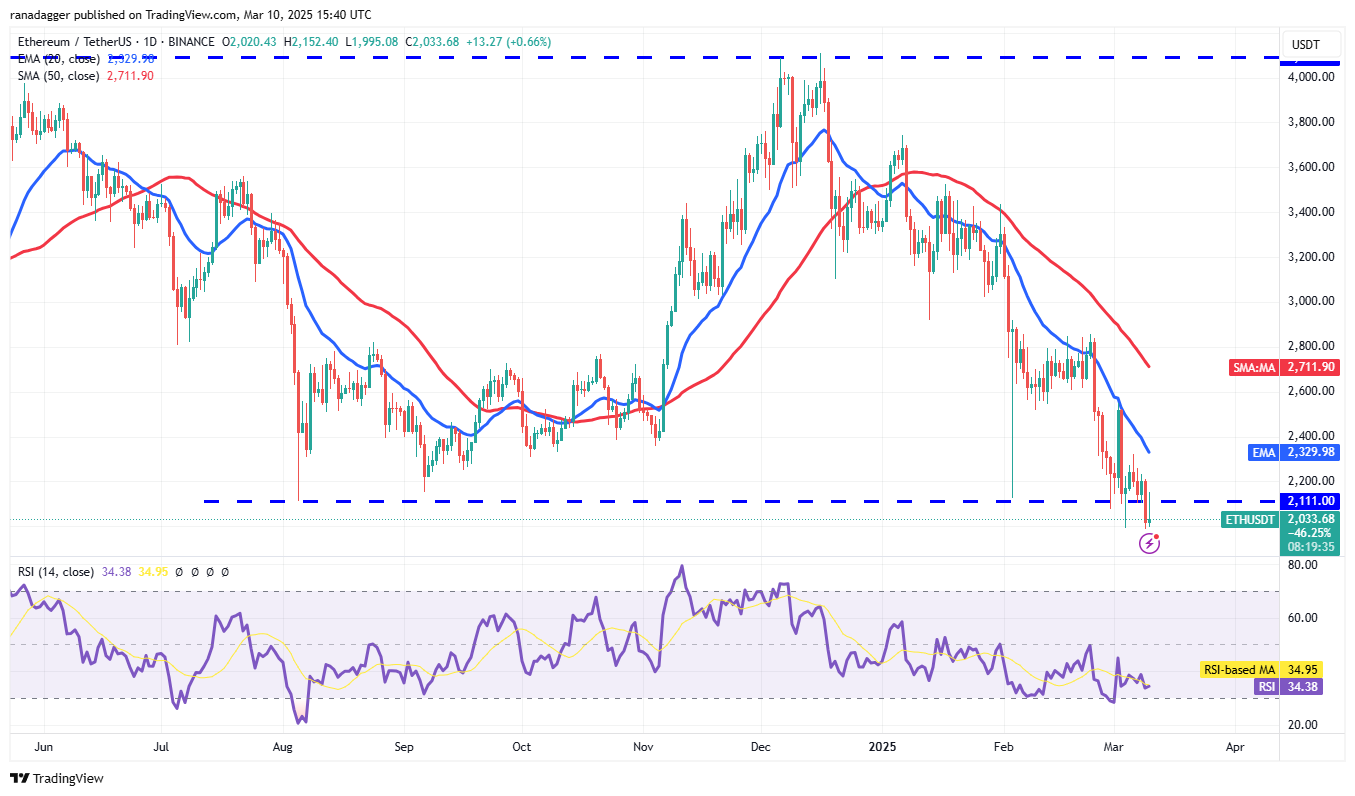
ETH/USDT daily chart. Source: Cointelegraph/TradingView
ETH fell below the key $2,111 support on March 9. A brief recovery attempt faced rejection, indicating continued pressure.
-
If $1,993 fails, downside targets are $1,750, then $1,550
-
A close above $2,329 (20-day EMA) could signal a bear trap
📉 XRP
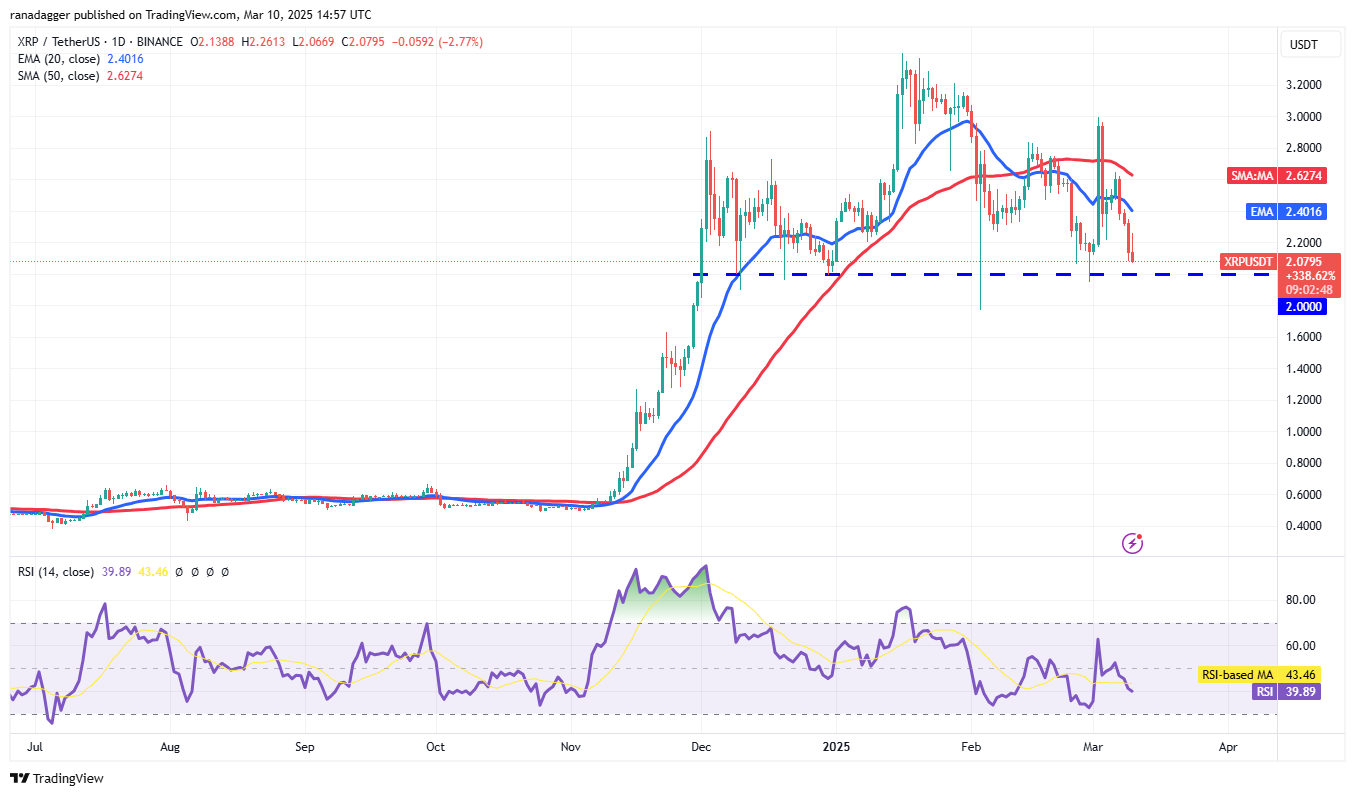
XRP/USDT daily chart. Source: Cointelegraph/TradingView
XRP is sliding toward crucial $2 support. A break below would trigger a head-and-shoulders breakdown, with next support near $1.28.
Upside move only likely if XRP rebounds strongly off $2, targeting $2.80 if it clears $2.40 (20-day EMA).
BNB
BNB rejected from the 20-day EMA ($601) and dropped below $546. If this level doesn’t hold, the next support is between $500 and $460.
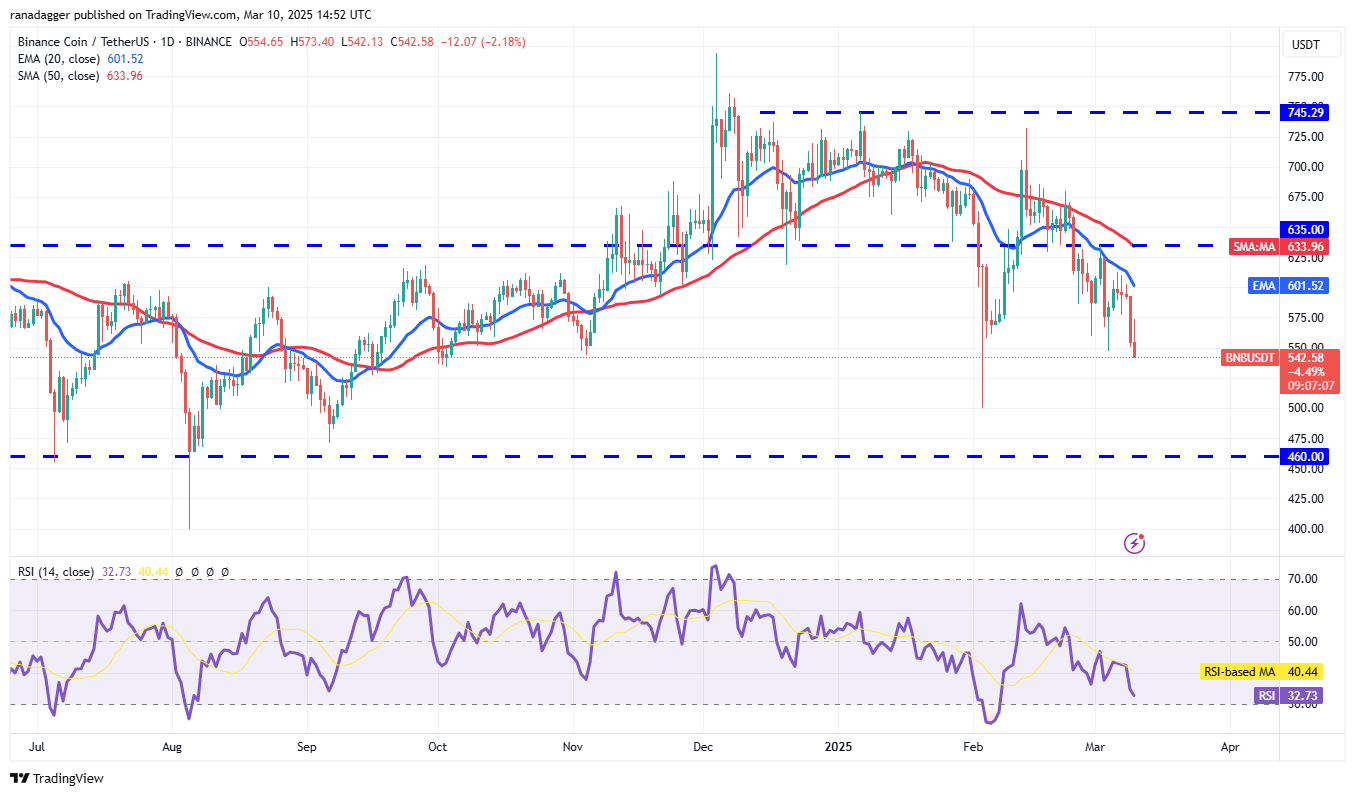
BNB/USDT daily chart. Source: Cointelegraph/TradingView
Resistance remains at the 50-day SMA ($633).
Solana price analysis
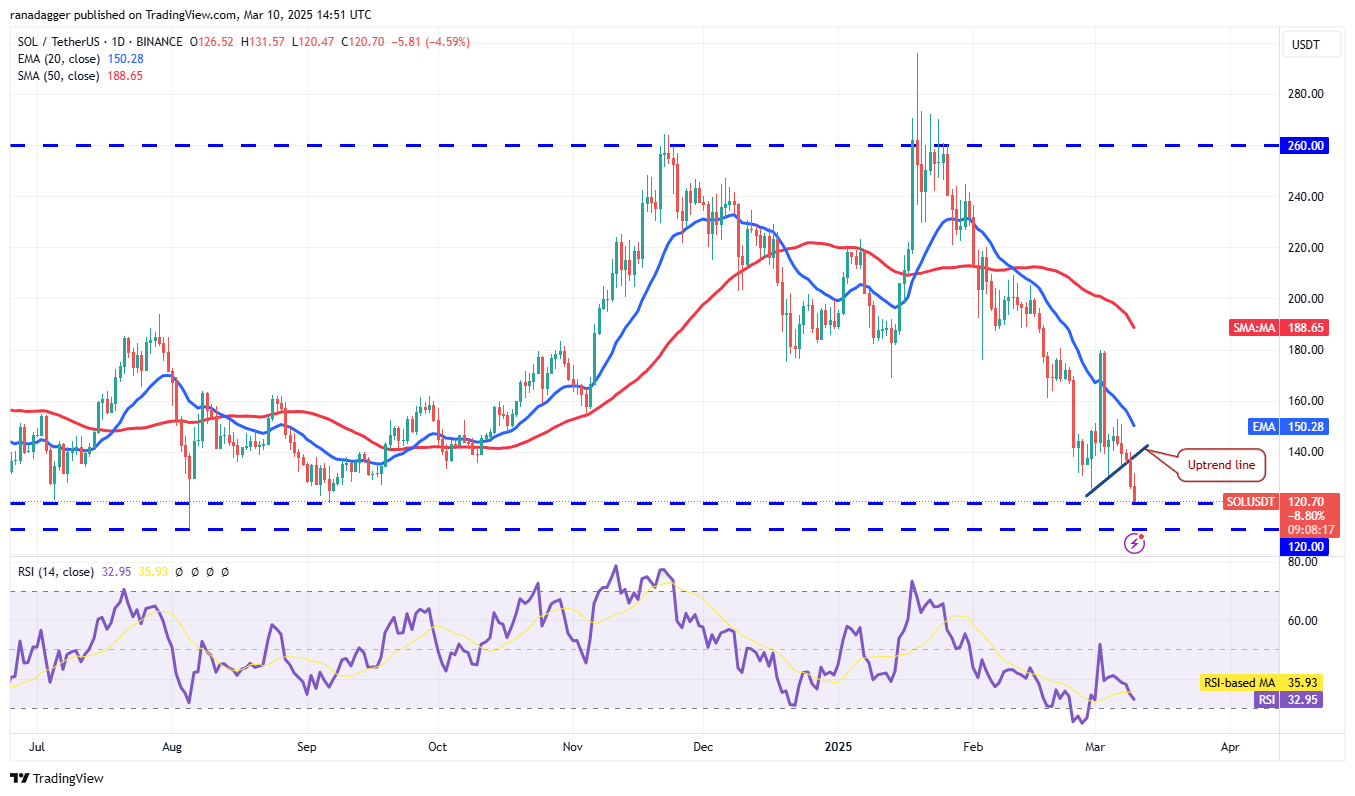
SOL/USDT daily chart. Source: Cointelegraph/TradingView
SOL broke below its uptrend line and entered a critical $120–$110 support zone.
-
Breakdown could lead to $100, then $80
-
Reclaiming the 20-day EMA ($150) would be the first bullish signal
Dogecoin price analysis
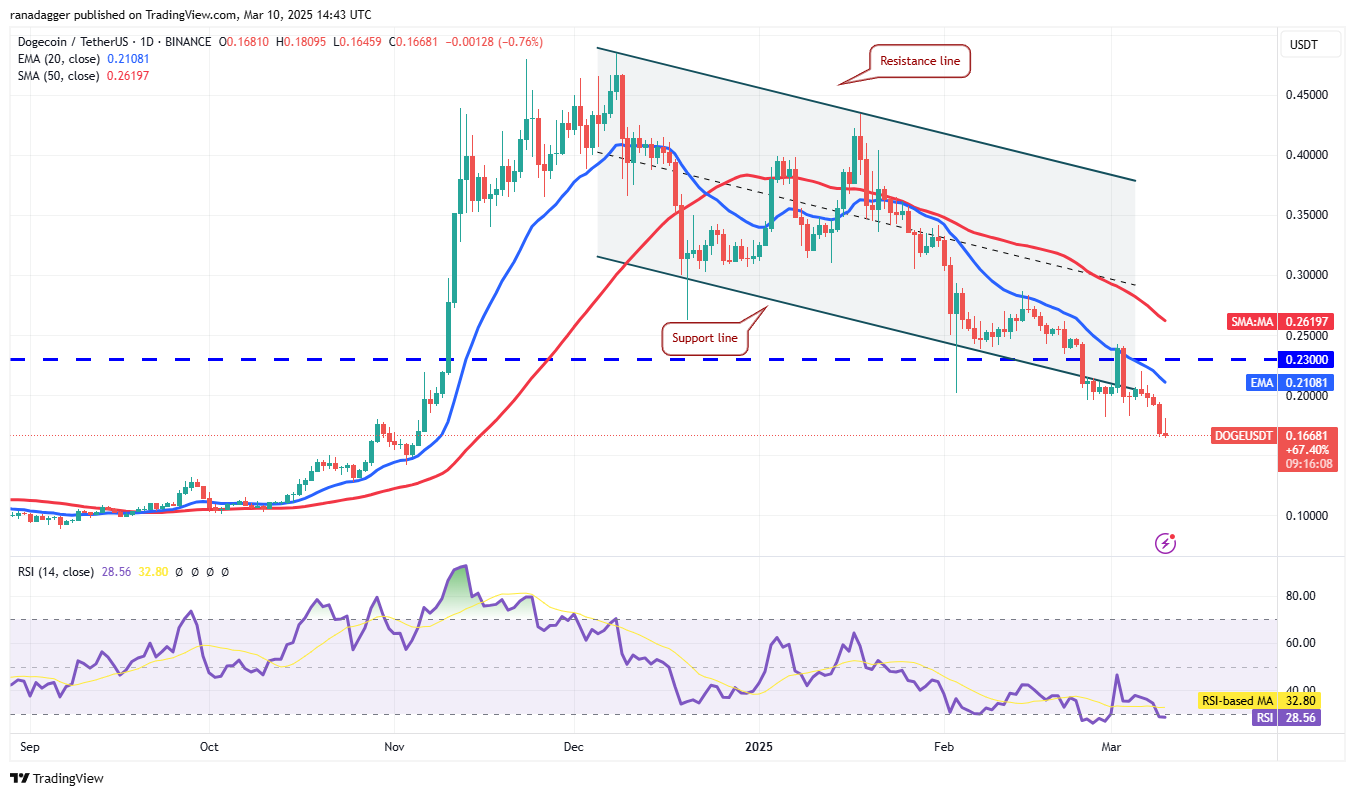
DOGE/USDT daily chart. Source: Cointelegraph/TradingView
DOGE slipped below $0.18, signaling trend continuation. Indicators show bearish control.
-
Next support: $0.14
-
Break above $0.21 (20-day EMA) could offer short-term relief
Cardano price analysis
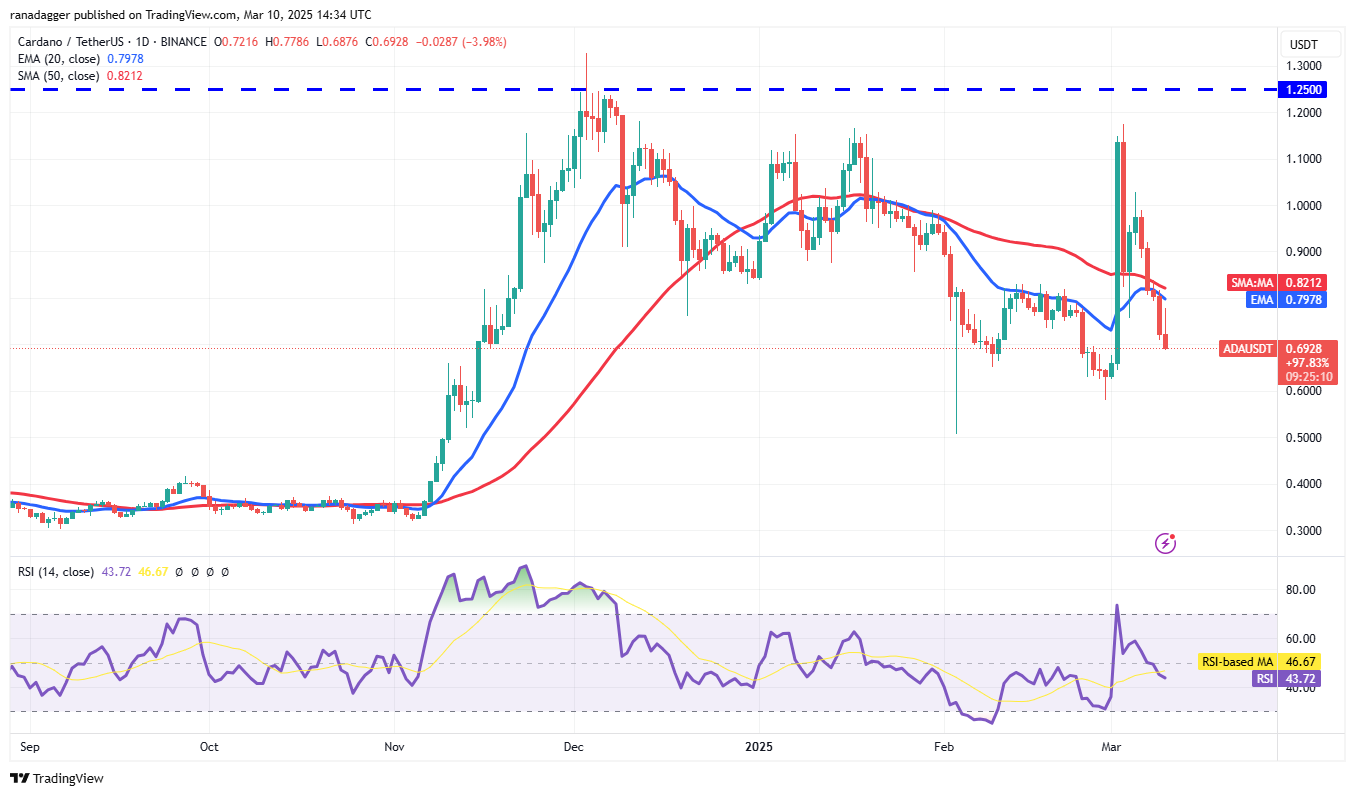
ADA/USDT daily chart. Source: Cointelegraph/TradingView
ADA broke below moving averages, and RSI entered negative territory.
-
Immediate support: $0.58, then $0.50
-
Upside possible only above moving averages, with a longer target of $1.02
Pi price analysis
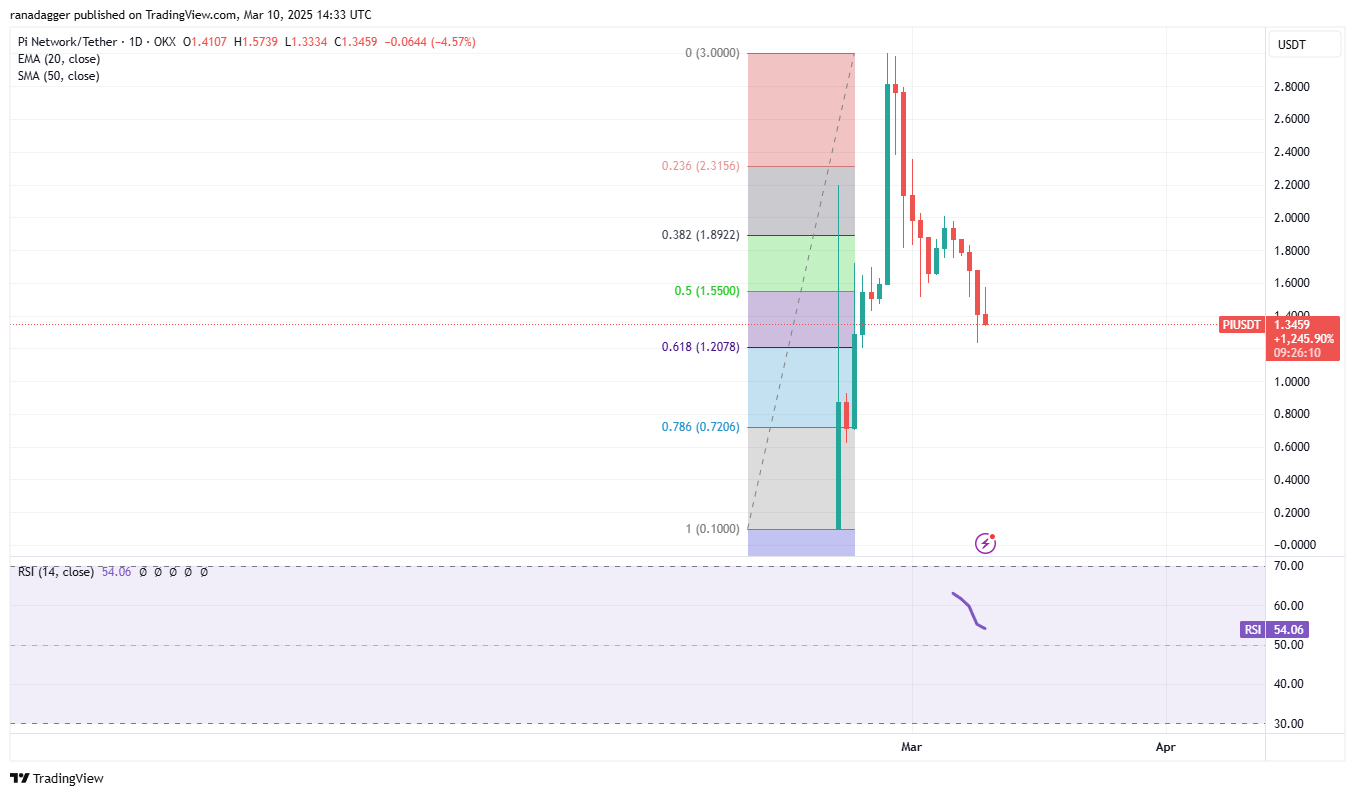
PI/USDT daily chart. Source: Cointelegraph/TradingView
PI retraced to the 61.8% Fibonacci level at $1.20, and buyers are struggling to reclaim higher levels.
-
A breakdown could send it to $0.72
-
Bulls must push above $2 to regain bullish momentum
📊 Market Summary: Bitcoin is in accumulation, but near-term technicals remain fragile across most top assets. Key support tests ahead will determine if a recovery is coming or if more downside is on the way.