


According to a recent X post by seasoned crypto analyst Ali Martinez, Ethereum (ETH) price could face further decline as it risks breaking down from an ascending triangle pattern – potentially crashing to as low as $800.
Ethereum To Crash To $800?
Ethereum (ETH) has struggled over the past three years, failing to reclaim its all-time high (ATH) of $4,878 from November 2021. Meanwhile, other cryptocurrencies like Bitcoin (BTC) and Solana (SOL) have surged to new ATHs earlier this year.
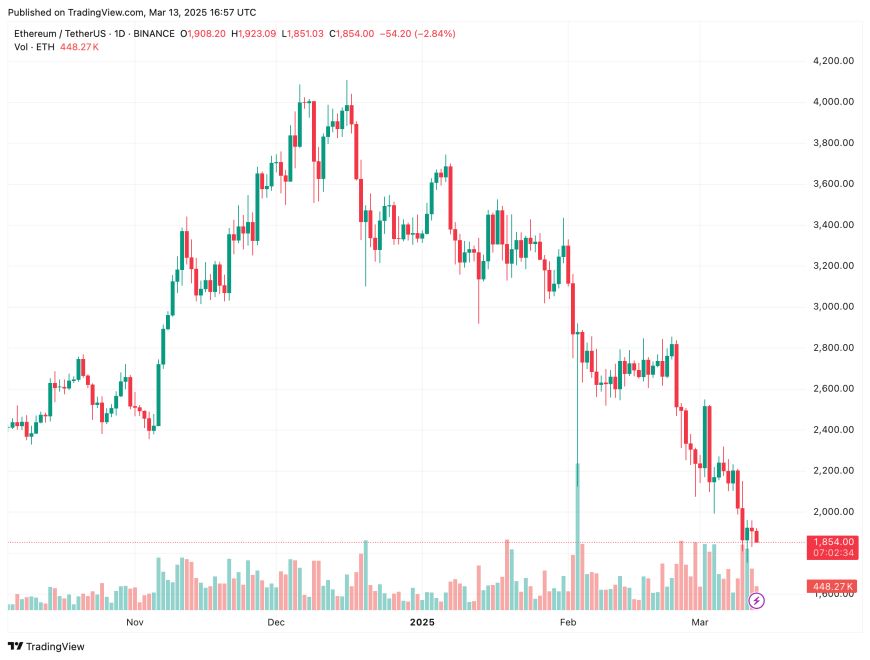
Amid a broader crypto market pullback driven by geopolitical tensions and tariff concerns, ETH has fallen 30% in the past month – dropping from $2,800 on February 13 to around $1,900 at the time of writing.
That said, Ethereum’s woes may still continue. Recent price analysis by Martinez highlights how ETH has been trading in an ascending triangle, and has so far failed to decisively break through the $4,000 resistance level.
The leading smart contract token has now broken down from the pattern, raising the possibility of a crash to as low as $800. The last time ETH traded at $800 was way back in December 2020.
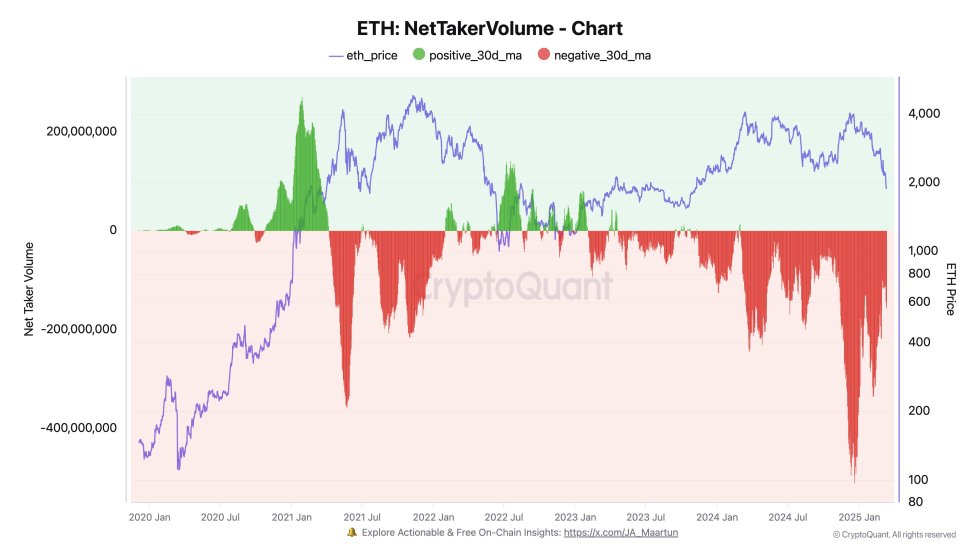
Ethereum’s below average price performance relative to other digital assets is further hampered by the relentless selling it has witnessed over the past few months. A post by CryptoQuant CEO, Ki Young Ju, shows that since January 2020, ETH has faced the highest selling in the first three months of 2025.
Further, recent analysis by another crypto analyst, Ted, emphasizes the similarity between the current ETH price crash and the capitulation candle in March 2020 due to the COVID pandemic. The analyst said:
I wouldn’t be surprised if ETH goes a bit lower from here towards $1.4K-$1.6K level. But that doesn’t mean everything is over. $10K ETH will happen this cycle.
All May Not Be Lost For ETH
While there is considerable pessimism about ETH’s short-term price action, some analysts suggest that the digital asset may soon witness a swift price recovery.
For instance, crypto trader Merlijn The Trader brought attention to Ethereum’s 3-year Stochastic Relative Strength Index (RSI) level. The analyst noted that ETH’s Stochastic RSI is significantly oversold, raising optimism for a potential “massive rally.”
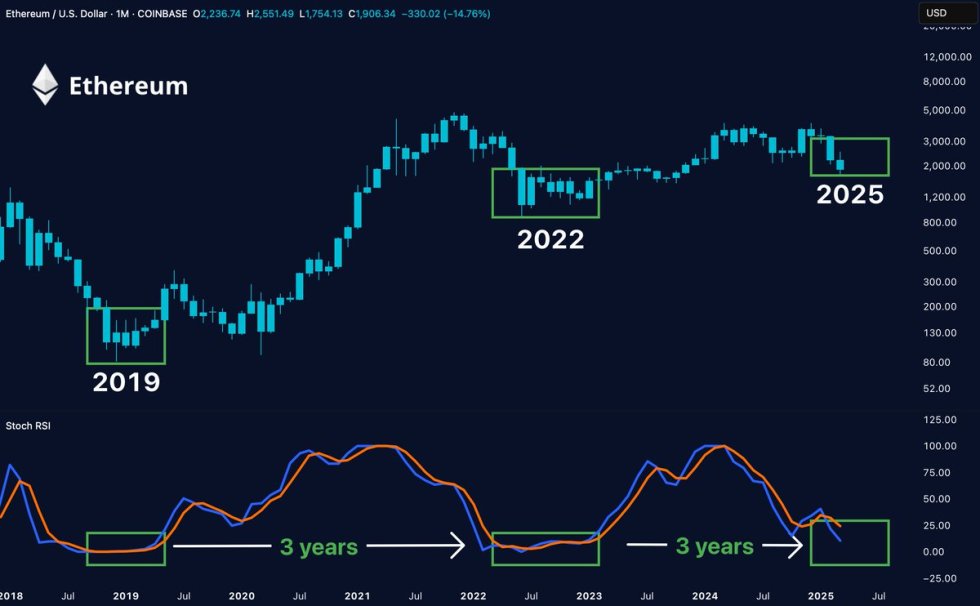
For the uninitiated, the Stochastic RSI is a momentum indicator that shows whether an asset is overbought or oversold by comparing the RSI to its recent range. It moves between 0 and 1, with values above 0.8 suggesting overbought and below 0.2 indicating oversold conditions.
In addition, recently crypto analyst Crypto Yoddha stated that ETH may have already hit the bottom for this market cycle. At press time, ETH trades at $1,854, down 1.2% in the past 24 hours.
Featured image from Unsplash, Charts from X and TradingView.com

Editorial Process for bitcoinist is centered on delivering thoroughly researched, accurate, and unbiased content. We uphold strict sourcing standards, and each page undergoes diligent review by our team of top technology experts and seasoned editors. This process ensures the integrity, relevance, and value of our content for our readers.