


- BERA’s price and liquidity flow move in opposing directions, raising market concerns among investors.
- On the chart, there’s still a possibility for a major market move as BERA approached a key demand zone known for historical rallies.
In the past 24 hours, Berachain [BERA] plunged by 10.72%, at the time of writing, placing it among the top market losers during this time frame, despite showing potential for a major rally earlier.
Despite this decline, a major rally is still possible, as different sentiment indicators—particularly liquidity netflow and chart patterns—suggest a bullish directional bias.
However, a further drop may be necessary first.
Liquidity flow against price
The drop in the past 24 hours, which has brought BERA to $6.69 at press time, is a move against the liquidity flow into its chain.
Over the past week, Berachain recorded the highest liquidity inflow, surpassing Ethereum, Solana, and other top chains, with $106.3 million added to its network.
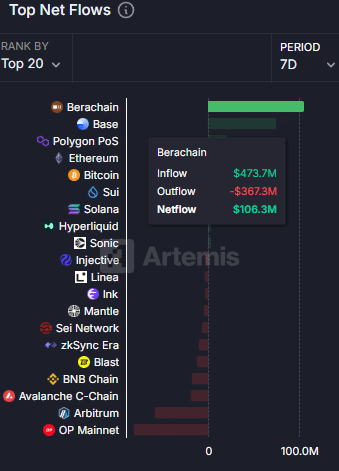
Source: Artemis
Price movements following such liquidity inflows tend to remain positive, with gradual and consistent gains or stability within a particular range.
To understand the context behind the price drop, it is essential to analyze the Total Value Locked (TVL)—an indicator that assesses a network’s value based on the assets deposited or locked across its protocols. TVL has seen a continued decline.
Since the 28th of March, Berachain’s TVL has dropped from a high of $3.493 billion to a current value of $3.144 billion, meaning $349 million has been removed from protocols across its blockchain in three days.
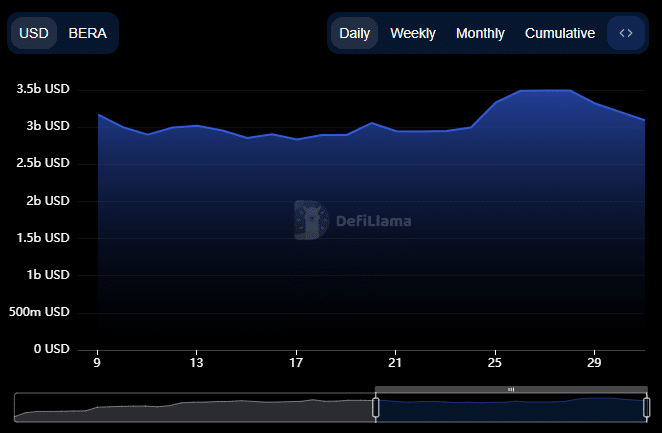
Source: DeFiLlama
This liquidity outflow has contributed to the significant price drop in the past 24 hours. However, per AMBCrypto’s analysis, this decline could have a positive effect on BERA’s next move.
BERA’s approaches key demand zones
On the chart, BERA is heading toward a key support level that has previously acted as a catalyst for upward price trends.
If downward pressure pushes BERA into the demand region between $6.5 and $5.8 (circled on the chart), it could rally to at least $8.71 and potentially continue upward toward $15.
The rally toward $15 is possible if BERA crosses the $8.71 resistance, forming a bullish flag pattern.
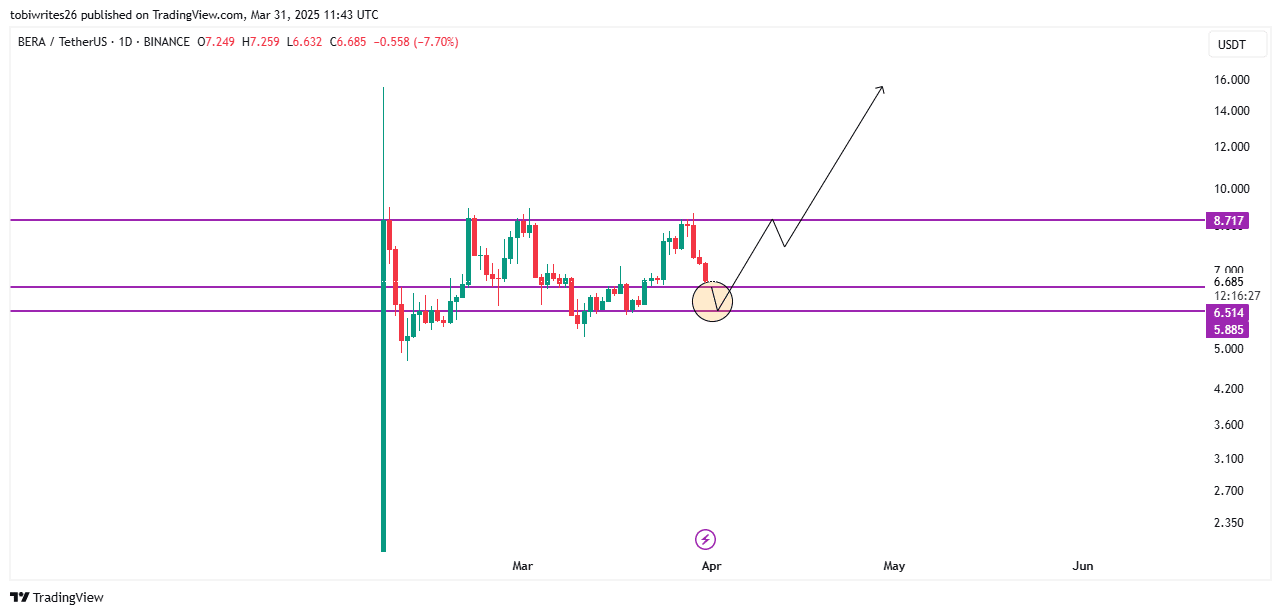
Source: TradingView
Adding to the bullish sentiment is the renewed buying activity in the spot market after several days of consistent selling. In the past 24 hours, a total of $627,000 worth of BERA has been purchased from exchanges.
When buying activity increases despite a price drop, it signals healthy market conditions. BERA’s decline is seen as an incentive for accumulation ahead of a potential price surge, especially if it trades down to the marked demand zone.
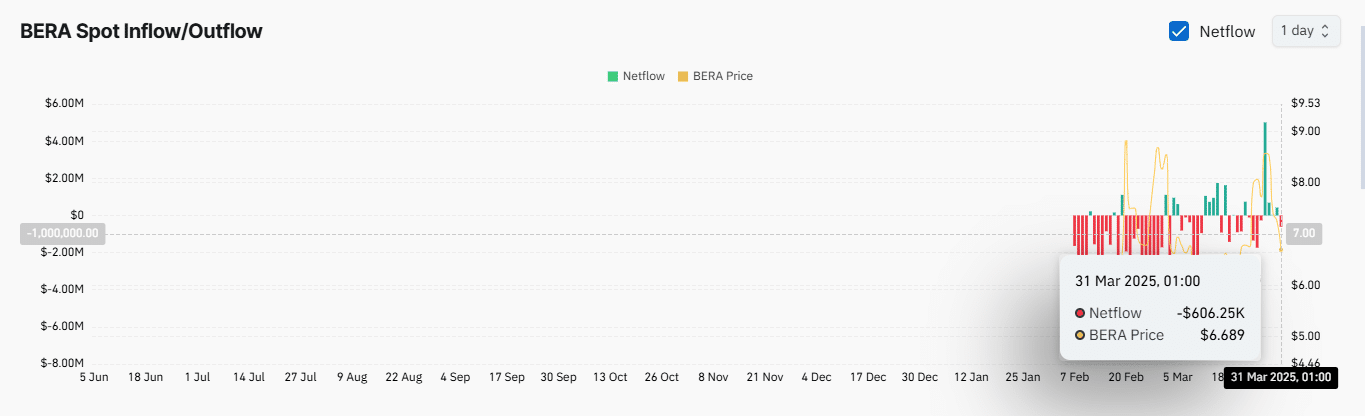
Source: Coinglass
Market sentiment remains divided
Traders on Binance have been bullish, with high buying volume compared to selling volume. This is evident as the long-to-short ratio has crossed above 1—currently at 1.0991.
However, the broader market trend presents an opposing view, with the overall long-to-short ratio below 1, indicating high selling pressure.
Source: Coinglass
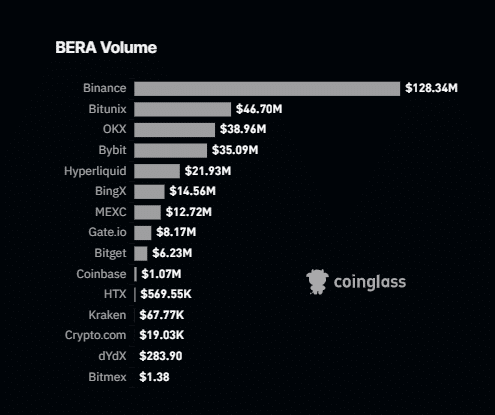
Binance traders going long against the broader market sentiment could slow BERA’s decline, given that Binance dominates BERA’s current trading volume.
Binance’s volume exceeds that of the next three exchanges—Bitunix, OKX, and Bybit—by $128.34 million, with their combined volume at $120.75 million.
Source: Coinglass
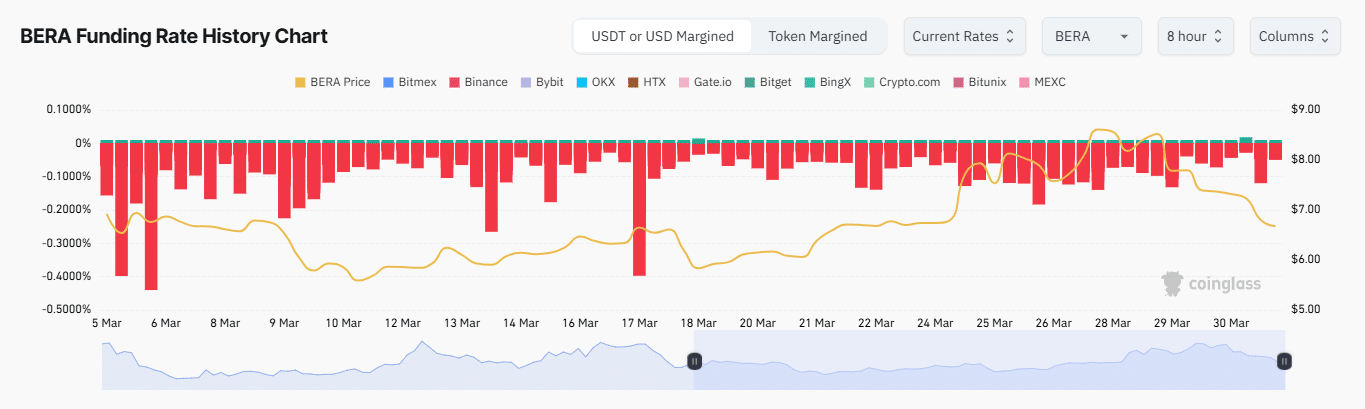
Additionally, BERA’s Funding Rate stood at -0.0415 %, meaning short traders are paying to maintain their positions. This highly negative rate suggests a strong bearish conviction among derivative traders.